# Opinion: The stock market is behaving in mysterious ways — is it bullish, bearish or something else?

Table of Contents
“#
Opinion: The stock market is behaving in mysterious ways — is it bullish, bearish or something else?
”
The “stodgy” side of the market is leading, while volatility is unusually high.
The stock market is doing something unusual, especially in these volatile times: It’s being led by the “old” and “stodgy” stocks of the Dow Jones Industrial Average
DJIA,
The Dow has hit record highs for three days, up about 1,400 points in the past four trading days to over 32,000. No other major index has followed along, although the S&P 500
SPX,
and the Russell 2000
RUT,
are not far away from new all-time highs of their own. The Nasdaq
COMP,
is lagging.
That saying refers to a time when General Electric
GE,
General Motors
GM,
and other “generals” were the mainstays of the Dow, so you can see how old it is. It is really just a way of saying that when the majority of stocks are weakening and not making new highs, it’s not a good sign when only 30 stocks are leading the way.
Institutional investors pile into stocks
We have different (hopefully better) ways of measuring divergence these days — specifically, cumulative breadth indicators, new highs vs. new lows, etc., so we don’t have to “stretch” to draw a conclusion about the Dow today.
I will say that the buyers of these Dow stocks are not the Robinhood crowd but are the “big boys” — institutional investors — and they are piling in like mad.
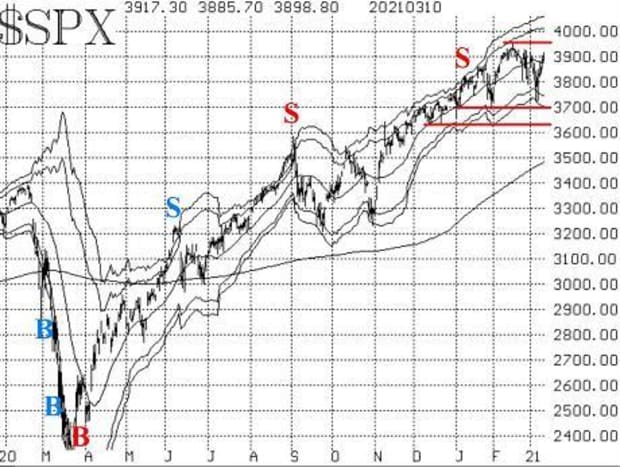
In any case, we usually use the S&P 500 as the measure of the broad stock market. The index is being dragged somewhat higher by the Dow stocks, as they are all big components of the S&P 500. Even so, the S&P 500 continues to run into resistance in the same area: 3,870 to 3,950 points.
A move above 3,950 — it’s close today — would be a new all-time high and bullish, requiring a “reset” of all the indicators.
Lacking that, the bears still have a chance to gain some leverage. It would not be surprising to see the S&P 500 remain in the broad trading range of 3,630 to 3,950. There is also support within that range, in the 3,700-3,725 area, where the S&P 500 bottomed out in both late January and early March. A move below 3,630 would be extremely bearish.
Volatility off the charts
Finally, it should be noted that intraday volatility has been very extreme in the past couple of weeks. The Market Insight segment of this newsletter has some views on that subject.
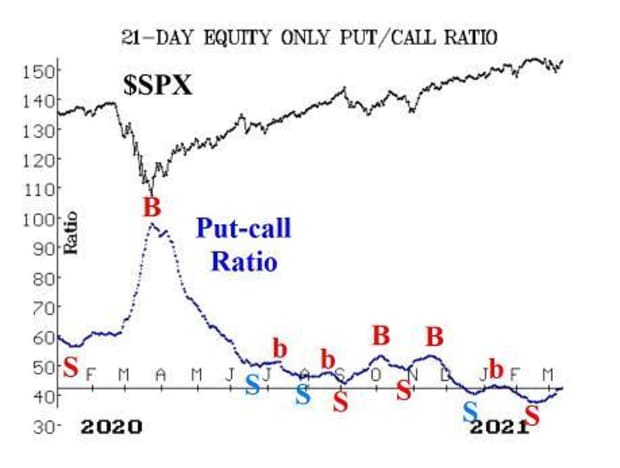
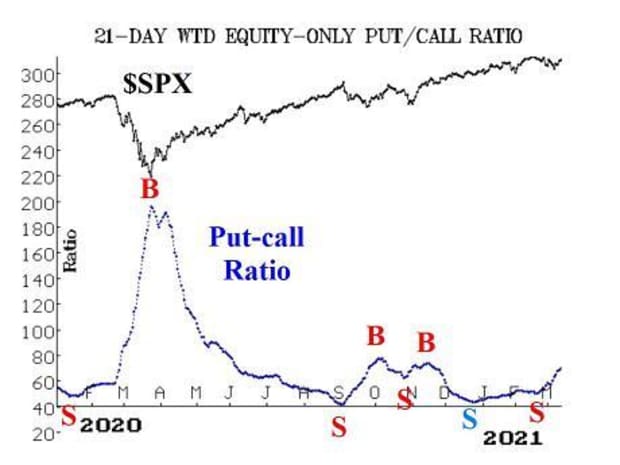
Equity-only put-call ratios are moving steadily higher and that puts them solidly on sell signals. Even so, they are still at very low levels on their charts, meaning that they are overbought. They are trying to work off this overbought condition, which will eventually lead to a healthier market. But they have plenty of room to move higher and will remain on these sell signals as long as they are rising.
Market breadth has improved tremendously over the past four trading days. At the market’s recent lows March 4, “stocks only” breadth had descended into a true oversold condition. Thus, the improvement in breadth this week has produced a solid buy signal. Both breadth oscillators are now back into modestly overbought territory (and on buy signals). The cumulative breadth indicators are improving but have not recovered enough to reach new all-time highs.
New 52-week highs vs. new 52-week lows remains a bullish indicator. There was a close call about a week ago, when the NYSE data almost produced a sell signal. But it did not, and now the number of new lows on the NYSE has descended back into single digits, while the number of new highs is exploding on this rally.
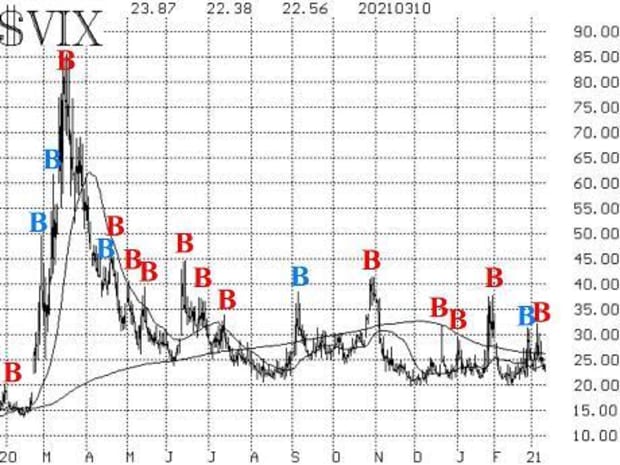
Volatility remains high, as VIX
VIX,
continues to trade well above 20. The VIX “spike peak” buy signal of March 4 remains in place and will continue to do so until early April, unless it is stopped out by VIX spiking higher once again. VIX is back below its 200-day moving average. Also, the 20-day moving average is below the 200-day. Thus, the trend of VIX remains downward, and that is bullish for stocks too.
The construct of volatility derivatives has remained solidly bullish for some time. In the last couple of weeks, when other indicators were (are) weakening, this construct — along with the “new highs vs. new lows” indicator — remained the bulls’ best friend.
The April VIX futures are now trading with a large premium over the March VIX futures. As long as that remains the case, it is a bullish sign for stocks. The March futures expire next week — on March16 — so the “torch” will pass to April as the front month.
At that time, we will begin looking at the relationship between April and May futures. It is bullish as well, as May futures are trading about 1.50 over the price of April futures. The term structure of the CBOE Volatility Indices slopes upward, too. All of these are currently bullish signs for stocks.
In summary, the S&P 500 is still running into resistance and, as long as that is the case, there is a chance that it’s still in its trading range and could retest the lows of the range. A breakout above 3,950 would be bullish (and likewise, a breakdown below 3,630 would be bearish).
Market Insight: Intraday volatility explodes
Over the past 12 trading days, intraday volatility has been extreme in the major averages. That is unusual in a market that is moving sideways or even up. Yes, in a bear market, such as we saw a year ago, extreme volatility is to be expected. But over these past 12 days, the S&P 500 is up 22 points — not much, but up nonetheless.
However, the average true range is 80 points per day. “True range” measures not just the trading day’s difference between its high and its low, but if the market gapped higher, for example, it includes that gap.
Suppose the S&P 500 closed at 3,800 one day. Then, suppose it opens on a gap higher at 3,850 the next day, and continues on to 3,900 on that same day. The true range would be 100 points (3,900–3,800) because that’s how much the market moved from its previous close to the next day’s high.
We have seen three such upside gaps in the past 12 days, along with plenty of intraday volatility in stocks, and that makes the average true range (ATR) 80 points — or 2% per day. For the S&P 500 to move 80 points on any day is a big move, and for it to average that much over 12 consecutive trading days is unheard of.
Some analysts are fearful that this is a sign of over-speculation and “gambling” in the stock market. Others accept it for what it is and deal with it. Short-term traders love it. Fundamental analysts trying to assess the worth of a company hate it, because if a company’s stock is “worth” $X, how can it move large percentages in the blink of an eye?
That question alone should lead one to be wary of fundamental analysis. As options traders, it should work to our benefit. This is a major reason why VIX has remained so high, even though most indices have been making new all-time highs with great frequency since last November.
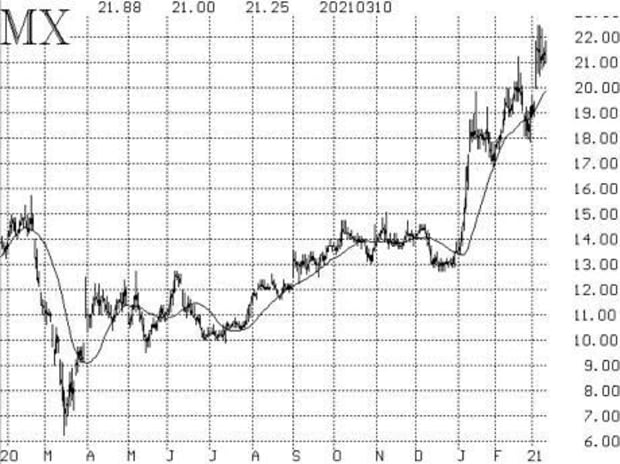
New recommendation: MagnaChip Semi
MagnaChip Semiconductor
MX,
is a takeover rumor. Stock volume patterns are extremely strong and improving rapidly. Moreover, options implied volatility has increased sharply. There is support at $20. The stock has broken out to a nearly eight-year high.
Buy 3 MX Apr (16th) 20 calls at a price of 3.25 or less.
MX: 21.20 April (16th) 20 calls: 3.10 bid, 3.40 asked
Previous recommendation: we are going to withdraw the recommendation of a “new highs vs. new lows” sell signal. New lows are back to single digits, while new highs are multitudinous. So, the recommendation – while technically still a valid one – is canceled because the chances of it occurring now are too small. We will reinstate it when it becomes more viable.
Follow-up action:
All stops are mental closing stops unless otherwise noted.
Long 500 CLIR common stock: the stop remains at 4.13.
Long 5 IVZ Mar (19th) 22 calls: the stop remains at 22.50.
undefinedthis trade is based on the 20-day Historical Volatility sell signal. This trade will be stopped out if the 20-day HV of SPX falls back below 9%.
Long 1 SPY Mar (19th) 390 put and Short 1 SPY Mar (19th) 360 put: This trade was established in line with the McMillan Volatility Band (MVB) sell signal of
January 15th. It would be stopped out if SPX were to once again close above the +4σ Band. Of course, that would then set up another potential MVB sell signal down the road.
Long 0 ZNGA Mar (19th) 11 calls: these call were stopped out on March 5th.
Long 1 SPY Mar (12th) 391 put and Short 1 SPY Mar (12th) 361 put: this position was bought at the close of trading on February 18th, when the number of declining issues outnumbered advancing issues on the NYSE by 1200 total issues: Close it out if SPX closes above 3950.
Long 4 AJRD1 Mar (19th) 50 calls: hold without a stop initially, to see how LMT handles the potential FTC problem. AJRD has declared a special dividend of $5.00 per share. The ex-date for this special dividend was March 9th. Option holders will be kept intact for the dividend. That is, on March 9th, the symbol for an AJRD option will change to AJRD1, and it will be exercisable into the strike price (which will remain unchanged) plus $500 in cash. The stock price itself will drop by $5 on March 9th, and therefore the net effect to an option holder is zero change. The takeover price that Lockheed-Martin (LMT) will pay will be reduced from the current $56 to $51.
If that all seems confusing, this might help: with AJRD trading at 46, after the special dividend, the intrinsic value of the AJRD1 Mar (19th) 50 call is equal to the price of AJRD minus 50 (the strike) + 5 (the dividend). In this case, with ADJRD = 46, the intrinsic value is 1 (46 – 50 +5).
Long 2 SPY Mar (26th) 382 puts and Short 2 SPY Mar (26th) 340 puts: this position was established at the close of trading on February 25th, when SPX closed below 3870. Also, note that there were no 341 or 342 strikes for this expiration, so the 340 puts were sold instead. Stop yourself out SPX closes above 3950.
Long 2 SPY April (9th) 377.5 calls and Short 2 SPY April (9th) 392.5 calls: this position was taken in line with the VIX “spike peak” buy signal of March 4th. It will remain in place for 22 days, unless stopped out by a return to “spiking mode” by VIX (a gain of at least 3.00 points by VIX – using closing prices – over any 1-, 2-, or 3-day period). If it stopped out in that manner, then prepare to take the next buy signal, according to the rules that were laid out in last week’s newsletter.
Send questions to: [email protected].
Lawrence G. McMillan is president of McMillan Analysis, a registered investment and commodity trading advisor. McMillan may hold positions in securities recommended in this report, both personally and in client accounts. He is an experienced trader and money manager and is the author of the best-selling book, Options as a Strategic Investment.
Disclaimer: McMillan Analysis Corporation is registered with the SEC as an investment advisor and with the CFTC as a commodity trading advisor. The information in this newsletter has been carefully compiled from sources believed to be reliable, but accuracy and completeness are not guaranteed. The officers or directors of McMillan Analysis Corporation, or accounts managed by such persons may have positions in the securities recommended in the advisory.
If you liked the article, do not forget to share it with your friends. Follow us on Google News too, click on the star and choose us from your favorites.
For forums sites go to Forum.BuradaBiliyorum.Com
If you want to read more News articles, you can visit our News category.


