#In One Chart: Some stock market ‘complacency creeping in’ after S&P 500’s ‘near-perfect retracement’ of selloff: chart watcher

Table of Contents
“In One Chart: Some stock market ‘complacency creeping in’ after S&P 500’s ‘near-perfect retracement’ of selloff: chart watcher”
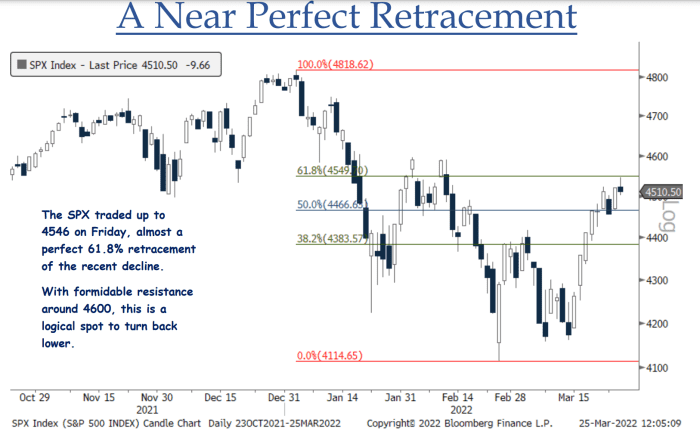
The S&P 500 is knocking on the door of what could be stiff, near-term resistance after completing an almost perfect retracement of its fall from a January record to its February low, a top Wall Street chart watcher said.
The large-cap benchmark
SPX,
rallied around 9% in the nine sessions that ended Friday, when it closed at 4,543.06 after trading as high as 4,546.03. That marked a “near perfect” 61.8% recovery of its fall from a record intraday high of 4,818.62 on Jan. 4 to its Feb. 24 intraday low of 4,114.65, said Jonathan Krinsky, chief market technician at BTIG, in a Sunday note. An exact 61.8% retracement would have put the S&P 500 at 4,549 (see chart below).
BTIG
What’s important about 61.8%? Many technical analysts pay attention to what’s known as the Fibonacci ratio, attributed to a 13th century Italian mathematician known as Leonardo “Fibonacci” of Pisa. It’s based on a sequence of whole numbers in which the sum of two adjacent numbers equals the next highest number (0,1,1,2,3,5,8,13, 21…).
If a number in the sequence divided by the next number, for example 8 divided by 13, the result is near 0.618, a figure that’s been dubbed the Golden Mean due to its prevalence in nature in everything from seashells to ocean waves to proportions of the human body. Back on Wall Street, technical analysts see key retracement targets for rally from a significant low to a significant peak at 38.2%, 50% and 61.8%, while retracements of 23.6% and 76.4% are seen as secondary targets.
The S&P 500 was down 0.1% in choppy trade Monday morning, while the Dow Jones Industrial Average
DJIA,
fell more than 150 points, or 0.4%, and the Nasdaq Composite
COMP,
ticked up 0.2%.
The stock market’s resilience in the face of surging interest rates, soaring commodity prices and general macro headwinds should be respected, Krinsky wrote, but warned that he also sees “a bit of complacency creeping in” with put/call ratios falling back toward year-to-date lows. Puts are options that give the holder the right but not the obligation to sell the underlying asset at a set price by a certain time, while calls confer the same right to buy at a set price by a certain time.
A fall in the amount of puts versus calls could signal investors are less wary of a market drop. Krinsky also warned that credit markets have failed to show the same enthusiasm as equities recently.
It all means the risk vs. reward outlook for stocks is “generally less favorable” as the S&P 500 approaches 4,600, he wrote, but noted that a fall in correlations between index components, as measured by the Cboe Implied Correlation Index, “means sector and stock selection are more important than market direction” right now and that there are “opportunities on both the long and short side.”
Correlations would be expected to reassert themselves, however, if the market falls, he said.
–Tomi Kilgore contributed to this article.
If you liked the article, do not forget to share it with your friends. Follow us on Google News too, click on the star and choose us from your favorites.
For forums sites go to Forum.BuradaBiliyorum.Com
If you want to read more News articles, you can visit our News category.


