#Deep Dive: This is the window of time when value can outperform growth in the stock market

Table of Contents
“#Deep Dive: This is the window of time when value can outperform growth in the stock market”
Companies categorized as “value” are expected by analysts to increase earnings more quickly than their growth peers
Big Tech often hogs all the headlines.
But so far this year, large-cap value stocks — those that typically trade lower to book value and earnings and have slower growth rates — have been outperforming growth stocks.
The policy turnaround by the Federal Reserve toward stifling inflation has led to significant declines for many technology stocks that trade at high multiples to earnings.
But what might surprise you is that large-cap value stocks as a group are expected to increase earnings per share more quickly than growth stocks this year and for the two years through 2023. Those estimates are below.
Value’s time to shine?
Based on a multi-decade data analysis, John Buckingham, a value stock portfolio manager and editor of The Prudent Speculator newsletter, wrote in a note to clients on Jan. 17 that although stocks in general perform better when the Fed is cutting interest rates, “[v]alue has enjoyed terrific annualized returns, on average, when the Fed is tightening monetary policy.”
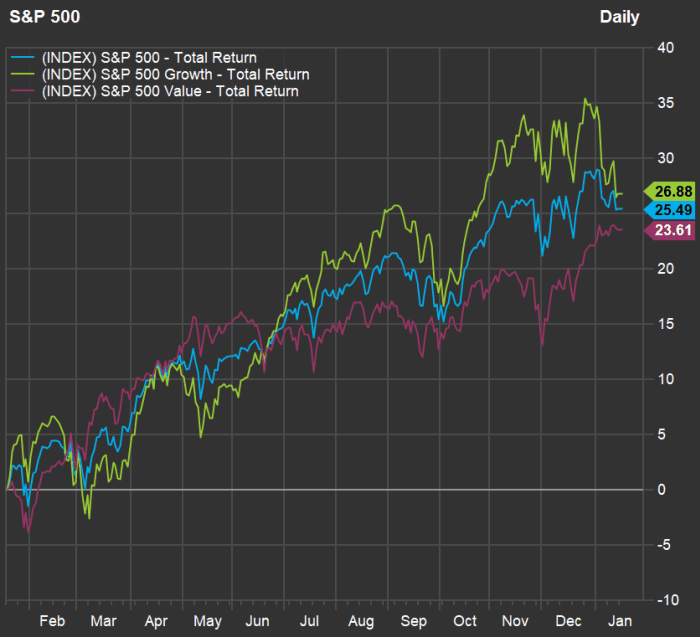
See this one-year chart through Jan. 14 showing total returns, with dividends reinvested, for the S&P 500 Index
SPX
and two overlapping subsets of the benchmark, the S&P 500 Growth Index and the S&P 500 Value Index:
FactSet
The value group has been the up-and-comer so far in 2022. Also of note, the yield on 10-year U.S. Treasury notes has increased to 1.84% from 1.52% on Dec. 31 and 1.11% a year ago.
Buckingham wrote: “Value stocks have a long way to go just to make it back to equilibrium with their more richly valued peers.”
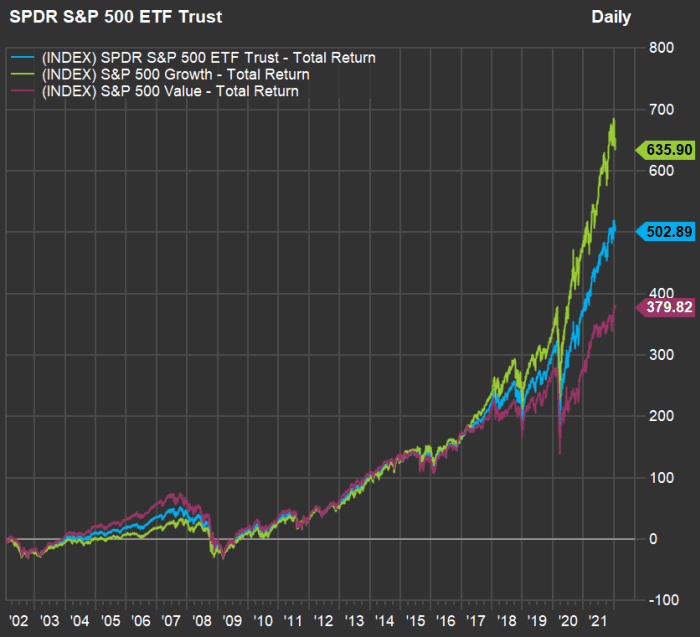
This 20-year total-return chart bears that out:
FactSet
The S&P 500 Value Index has greatly underperformed the S&P 500 Growth Index and the full S&P 500 over the past 20 years, although growth’s outperformance has been most pronounced during the pandemic. The first chart indicates investors’ moods have been changing in favor of value recently, and the Fed’s new anti-inflation stance — its first since the 1980s — might underline a real multiyear run for value.
Another way to test Buckingham’s statement is to look at relative forward price-to-earnings multiples for exchange traded funds that track all three groups of large-cap stocks:
| ETF | Ticker | Forward P/E | 20-year average forward P/E | Current valuation to 20-year average | Current valuation to S&P 500 | 20-year average valuation to S&P 500 |
| SPDR Portfolio S&P 500 Growth ETF | SPYG | 26.24 | 18.75 | 140% | 127% | 121% |
| SPDR Portfolio S&P 500 Value ETF | SPYV | 17.03 | 13.35 | 128% | 82% | 86% |
| SPDR S&P 500 ETF Trust | SPY | 20.73 | 15.48 | 134% | ||
| Source: FactSet | ||||||
All three groups of stocks trade high on a forward P/E basis, when compared to their 20-year averages. But the value group’s forward P/E hasn’t risen as much and it is still trading lower to the full S&P 500’s value than it has, on average, over the past two decades.
Quite a bit depends on your own opinion. If you expect interest rates to rise significantly over the next couple of years and for that to help lead to a real change in behavior among stock investors, it’s value’s time in the sun.
Value’s surprise earnings power
Investors rightfully expect growth stocks to increase sales and earnings more quickly than value stocks. Looking at weighted aggregate consensus estimates for the ETFs, as calculated by FactSet, analysts expect the growth group to increase sales more quickly, as usual. But look at the earnings-per-share estimates:
| ETF | Ticker | Est. EPS – 2021 | Est. EPS – 2022 | Est. EPS – 2023 | Est. EPS – 2024 | Est. EPS increase – 2022 | 2-year Est. EPS CAGR |
| SPDR Portfolio S&P 500 Growth ETF | SPYG | $2.43 | $2.61 | $2.88 | $3.23 | 7.4% | 8.9% |
| SPDR Portfolio S&P 500 Value ETF | SPYV | $2.25 | $2.49 | $2.73 | $2.92 | 10.7% | 10.2% |
| SPDR S&P 500 ETF Trust | SPY | $20.47 | $22.34 | $24.53 | $27.00 | 9.1% | 9.5% |
| Source: FactSet | |||||||
The value group is expected to achieve the most rapid EPS increase this year, and to have the best two-year compound annual growth rate for EPS through 2023.
Value stock screen
S&P Dow Jones Indices breaks the full S&P 500 into two growth and value subsets that are about the same size when it comes to market capitalization, with about 34% of stocks falling into both groups, as described here.
There are 239 stocks in the S&P 500 Growth Index, and it is highly concentrated, with the five largest holdings of the SPDR S&P 500 Growth ETF making up nearly 44% of the portfolio. The biggest holding is Apple Inc
AAPL,
at 13.3%, followed by Microsoft Corp.
MSFT,
at 11.4%, then Alphabet Inc.’s Class A
GOOGL
and Class C
GOOG
shares at a combined 8%. Amazon.com Inc.
AMZN
is at 7%, and Tesla Inc.
TSLA
at 4.2%.
There are 449 stocks in the S&P 500 Value Index, and it is far less concentrated, with Berkshire Hathaway Inc.
BRK
the largest holding at 3.1% of the SPDR S&P 500 Value ETF portfolio and the top five names making up 10.3%.
Within the S&P 500 Value Index, these 20 stocks have the most implied upside potential, based on consensus price targets, among those rated “buy” or the equivalent by at least 75% of analysts polled by FactSet:
| Company | Ticker | Share “buy” ratings | Closing price – Jan. 14 | Consensus price target | Implied 12-month upside potential | Also in S&P 500 Growth Index? |
| Bath & Body Works Inc. | BBWI | 85% | $55.83 | $90.39 | 62% | Yes |
| Caesars Entertainment Inc. | CZR | 94% | $82.84 | $133.36 | 61% | Yes |
| T-Mobile US Inc. | TMUS | 84% | $108.52 | $163.74 | 51% | No |
| Catalent Inc. | CTLT | 93% | $108.24 | $160.42 | 48% | Yes |
| PayPal Holdings Inc. | PYPL | 82% | $178.42 | $262.67 | 47% | Yes |
| Bio-Rad Laboratories Inc. Class A | BIO | 83% | $628.23 | $918.75 | 46% | Yes |
| Match Group Inc. | MTCH | 75% | $121.15 | $172.63 | 42% | No |
| Salesforce.com Inc. | CRM | 84% | $231.23 | $328.18 | 42% | Yes |
| News Corp. Class A | NWSA | 88% | $22.72 | $31.91 | 40% | No |
| Alaska Air Group Inc. | ALK | 93% | $55.79 | $76.21 | 37% | No |
| AES Corp. | AES | 92% | $23.06 | $30.55 | 32% | No |
| Teledyne Technologies Inc. | TDY | 78% | $420.48 | $537.13 | 28% | No |
| Quanta Services Inc. | PWR | 83% | $106.64 | $136.19 | 28% | No |
| Laboratory Corp. of America Holdings | LH | 89% | $276.08 | $351.08 | 27% | Yes |
| Assurant Inc. | AIZ | 100% | $154.89 | $194.17 | 25% | No |
| Visa Inc. Class A | V | 86% | $214.67 | $269.08 | 25% | Yes |
| Nike Inc. Class B | NKE | 75% | $148.18 | $185.45 | 25% | Yes |
| General Motors Co. | GM | 80% | $61.10 | $75.88 | 24% | No |
| IQVIA Holdings Inc. | IQV | 90% | $247.34 | $305.24 | 23% | Yes |
| Synopsys Inc. | SNPS | 88% | $326.16 | $401.13 | 23% | Yes |
| Source: FactSet | ||||||
Click on the tickers for more about each company, including financials, estimates and corporate profiles.
Then read Tomi Kilgore’s detailed guide to the wealth of information available for free on the MarketWatch quote page
Note that 11 of the 20 are also included in the S&P 500 Growth Index, as indicated on the table.
News Corp.
NWSA
is the holding company of Dow Jones & Co., which owns MarketWatch.
Don’t miss: These 3 ETFs let you play the hot semiconductor sector, where Nvidia, Micron, AMD and others are growing sales rapidly
If you liked the article, do not forget to share it with your friends. Follow us on Google News too, click on the star and choose us from your favorites.
For forums sites go to Forum.BuradaBiliyorum.Com
If you want to read more News articles, you can visit our News category.
![#Panthers owner David Tepper appears to throw drink toward Jaguars fans from luxury box during 26-0 Carolina loss [Video]](https://s.yimg.com/ny/api/res/1.2/3zPJjHgcVDQKFFQl3BPp5A--/YXBwaWQ9aGlnaGxhbmRlcjt3PTEyMDA7aD04MDA-/https://media.zenfs.com/en/aol_yahoo_sports_800/5ab2d8baebf0e9557556accc931733e4)