#Deep Dive: A bargain you can’t ignore: Small-cap stocks are trading at their second-biggest discount in 20 years

Table of Contents
“#Deep Dive: A bargain you can’t ignore: Small-cap stocks are trading at their second-biggest discount in 20 years”
Small-caps as a group appear set for a much better 2022 than large-cap equities
Small-cap stocks, as a group, are bargain-priced relative to more popular large-caps, but you may be surprised at just how cheap they are. And wait until you see their performance from similar valuation levels.
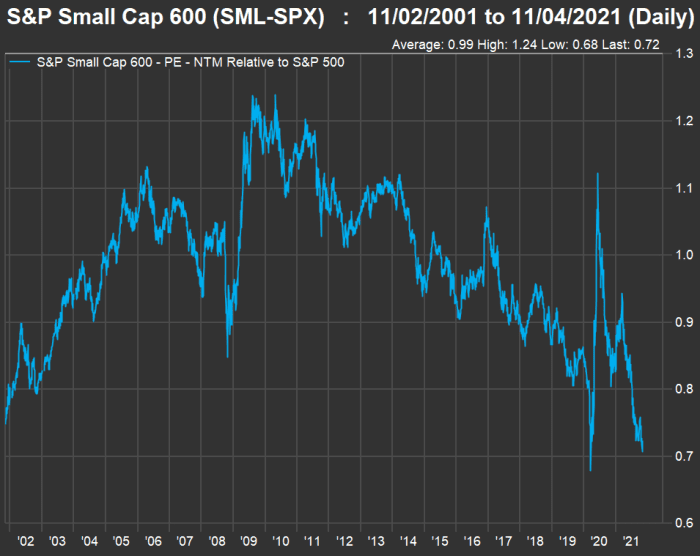
Look at this 20-year chart, which shows the weighted forward price-to-earnings ratio for the S&P Small Cap 600 Index
SML
versus the large-cap benchmark S&P 500 Index
SPX
:
FactSet
William Watts reported on what appears to be a breakout for small-cap stocks after eight months of relatively flat performance. That is based on the movement of the Russell 2000 Index
RUT.
In this article, we are focusing on the S&P Small Cap 600 Index, which is far more selective than the Russell 2000 because because most of its companies are profitable. Standard & Poor’s criteria for initial inclusion in the index includes positive earnings for the most recent quarter and for the sum of the most recent four quarters.
Aside from the early coronavirus pandemic doldrums of March 2020, the S&P 600 Small Cap Index hasn’t traded this low, relative to the S&P 500, in 20 years.
Here’s a breakdown of the relationship between current and average forward P/E ratios for the two indexes, using weighted data compiled by FactSet:
| Forward price-to-earnings ratios | ||||||
| Index | Current | 3-year average | 5-year average | 10-year average | 15-year average | 20-year average |
| S&P Small Cap 600 | 15.63 | 16.69 | 16.60 | 15.81 | 15.32 | 15.34 |
| S&P 500 | 21.59 | 19.49 | 18.69 | 16.72 | 15.54 | 15.72 |
| Valuation of S&P Small Cap 600 to S&P 500 | 72% | 86% | 89% | 95% | 99% | 98% |
The small-cap group typically trades much closer to the valuation of the large-caps than it does today.
Now take a look at a 20-year comparison of total returns for the two indexes:
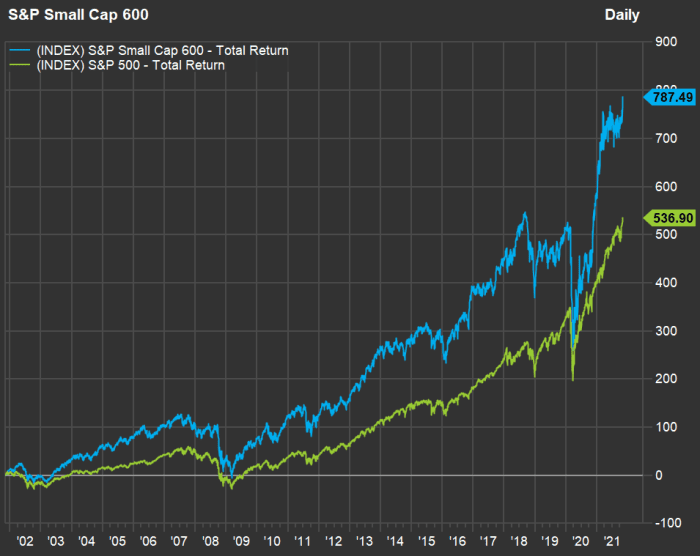
FactSet
In an extended bull market, driven in part by historically low interest rates, it is understandable that the best-known stocks (the large-caps) have had the most benefit. But all of the above argue for adding exposure to small-caps for the long term, as part of a diversified portfolio, especially if you have a lot of money in an S&P 500 index fund or exchange traded fund.
For a shorter-term case, see this comparison of aggregate consensus 2022 estimates among analysts polled by FactSet for the two indexes:
| Sales per share | |||
| 2021 | 2022 | Expected increase | |
| S&P Small Cap 600 | $1,170.21 | $1,261.61 | 7.8% |
| S&P 500 | $1,547.09 | $1,650.78 | 6.7% |
| Earnings per share | |||
| 2021 | 2022 | Expected increase | |
| S&P Small Cap 600 | $82.41 | $94.04 | 14.1% |
| S&P 500 | $202.11 | $218.74 | 8.2% |
| Free cash flow per share | |||
| 2021 | 2022 | Expected increase | |
| S&P Small Cap 600 | 74.46 | 89.86 | 20.7% |
| S&P 500 | 171.63 | 195.76 | 14.1% |
Good numbers across the board — but the estimates are higher for the small-cap group.
For both groups, the free-cash-flow estimates are comforting. Free cash flow is a company’s remaining cash flow after planned capital expenditures. It is money that can be used for expansion, dividend increases, stock buybacks or other corporate purposes.
How to get exposure to small-caps
If you are fortunate enough to have access to an employer-sponsored retirement account, the most important piece of advice anyone can give you is to contribute at least as much as your employer’s maximum contribution. If you do that, you have an immediate 100% return on your contributions.
Then you should look at the fees charged by the mutual funds available within the 401(k) or similar plan. Index funds, which typically have lower expenses than actively managed funds, may be available, and these may include a small-cap fund. Your plan may also allow you to put money into a brokerage account, within which you can select exchange traded index funds that also have low expenses.
Here are a few ETFs that track the S&P Small Cap 600 Index:
-
iShares Core S&P Small Cap ETF
IJR -
SPDR Portfolio S&P 600 Small Cap ETF
SPSM -
Vanguard S&P Small Cap 600 ETF
VIOO
Small-stock screen: Analysts’ favorites for 2022
Among the S&P Small Cap 600, there are 24 stocks with 100% “buy” or equivalent ratings that are each covered by at least five analysts polled by FactSet. Here they are, sorted by the 12-month upside potential implied by the consensus price targets:
| Company | Industry | Closing price – Nov. 3 | Consensus price target | Implied 12-month upside potential |
|
QuinStreet Inc. QNST |
Advertising/Marketing Services | $13.44 | $26.80 | 99% |
|
Tactile Systems Technology Inc. TCMD |
Medical Specialties | $36.90 | $69.25 | 88% |
|
LendingTree Inc. TREE |
Finance/Rental/Leasing | $151.37 | $238.75 | 58% |
|
Talos Energy Inc. TALO |
Oil & Gas Production | $13.22 | $19.25 | 46% |
|
Cytokinetics Inc. CYTK |
Biotechnology | $36.67 | $52.50 | 43% |
|
Ichor Holdings Ltd. ICHR |
Semiconductors | $46.04 | $60.40 | 31% |
|
Ultra Clean Holdings Inc. UCTT |
Semiconductors | $55.35 | $72.58 | 31% |
|
Ligand Pharmaceuticals Inc. LGND |
Biotechnology | $159.96 | $207.86 | 30% |
|
Smart Global Holdings Inc. SGH |
Semiconductors | $56.22 | $72.00 | 28% |
|
TTM Technologies Inc. TTMI |
Electronic Components | $13.99 | $17.79 | 27% |
|
Vista Outdoor Inc. VSTO |
Recreational Products | $43.41 | $54.89 | 26% |
|
Harmony Biosciences Holdings Inc. HRMY |
Pharmaceuticals: Major | $42.93 | $53.80 | 25% |
|
Civitas Resources Inc. CIVI |
Integrated Oil | $53.89 | $66.17 | 23% |
|
Griffon Corp. GFF |
Building Products | $27.22 | $33.33 | 22% |
|
Korn Ferry KFY |
Personnel Services | $79.98 | $97.75 | 22% |
|
NeoGenomics Inc. NEO |
Medical/Nursing Services | $46.53 | $56.45 | 21% |
|
SPX Corp. SPXC |
Industrial Conglomerates | $62.09 | $75.25 | 21% |
|
LCI Industries LCII |
Miscellaneous Manufacturing | $149.50 | $178.00 | 19% |
|
Green Plains Inc. GPRE |
Chemicals: Specialty | $38.89 | $45.89 | 18% |
|
Digi International Inc. DGII |
Computer Peripherals | $23.13 | $27.10 | 17% |
|
Summit Hotel Properties Inc. INN |
Real Estate Investment Trusts | $10.44 | $11.60 | 11% |
|
Veritex Holdings Inc. VBTX |
Regional Banks | $42.75 | $46.50 | 9% |
|
Onto Innovation Inc. ONTO |
Electronic Production Equipment | $84.29 | $90.20 | 7% |
|
Axcelis Technologies Inc. ACLS |
Electronic Production Equipment | $59.04 | $57.17 | -3% |
| Source: FactSet | ||||
Click on the tickers for more about each company. Click here for Tomi Kilgore’s detailed guide to the wealth of information for free on the MarketWatch quote page.
Don’t miss: These are the four solar stocks to own for the long run
If you liked the article, do not forget to share it with your friends. Follow us on Google News too, click on the star and choose us from your favorites.
For forums sites go to Forum.BuradaBiliyorum.Com
If you want to read more News articles, you can visit our News category.