# Should you buy Apple stock? Here are the key numbers to look at now

Table of Contents
“#
Should you buy Apple stock? Here are the key numbers to look at now
”
These are the key metrics for and stock valuation for Apple, the world’s largest company.
Apple Inc. kicks off a new snapshot series for the most-searched-for companies on MarketWatch.
The quarterly review will show comparisons of key metrics to watch and companies’ most important issues to help investors makes decisions about whether to own shares.
Where Apple fits in
As the largest company in the world, when measured by market capitalization, Apple
AAPL,
is contrasted with its largest “big tech” rivals — the company remains mostly a hardware maker, while others among the largest tech players are growing sales more quickly and have businesses that center more on intellectual capital and services. But Apple’s Services category — including cloud storage and backup, digital content and payment services — is growing rapidly and is its second-lagest reported business category.
Key metrics
Apple’s fiscal year ends on the last Saturday in September. So its fiscal first quarter ended on Dec. 26. Here are some of the most important numbers that professional investors keep an eye on for the company and its rivals.
Sales growth
The company reports its sales by product/service line and also by geography. With its hardware focus, Apple’s business is highly seasonal, so sales in its December quarter made up 38% of sales over the past four reported quarters.
Here are sales comparisons by product/service category:
")
(Company filings)
And by geographical segment:
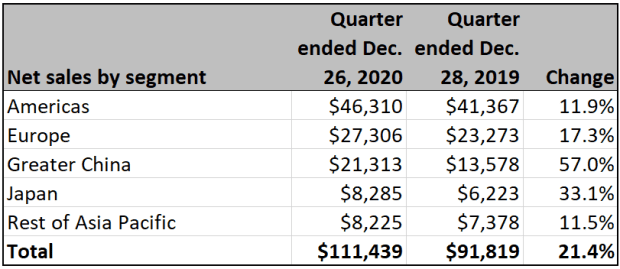
(Company filings)
Apple’s greatest sales growth was in China. This segment’s sales made up 19.1% of the total during the December quarter, up from 14.8% a year earlier.
Read: The pandemic may have permanently altered Apple’s path
Pricing power and profitability
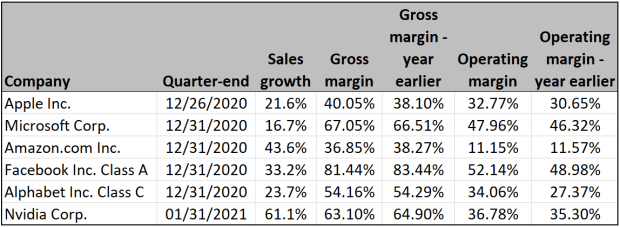
Here are year-over-year comparisons of gross margins and operating margins for Apple and five other large tech-oriented companies. Each company has a unique mix of business lines. This means a direct comparison isn’t meaningful. Apple and Nvidia Corp.
NVDA,
are mainly hardware companies. Facebook Inc.
FB,
is a service company. Microsoft Corp., Alphabet Inc.
GOOGL,
GOOG,
and Amazon.com Inc.
AMZN,
have all been successful in building large, international corporate cloud-services business — but all three derive more revenue from other lines.
Here’s a comparison of sales growth figures, gross margins and operating margins for all six companies for their most recent reported quarters and year-earlier quarters.
(FactSet)
A company’s gross margin is its sales, less the cost of goods sold, divided by sales. It is a measure of pricing power. An expanding gross margin with growing sales is a good sign. If the gross margin is contracting, it could mean a company is being forced to increase use of discounting to stave off competition. Comparing only two periods may not be especially meaningful, but it is important to understand if there is a trend.
Apple’s holiday-quarter gross margin expanded considerably year-over-year.
A company’s operating margin is its earnings before interest, taxes and depreciation divided by net sales. It can be considered “return on sales.”
All the listed companies expanded their quarterly operating margins except for Amazon.
Free cash flow
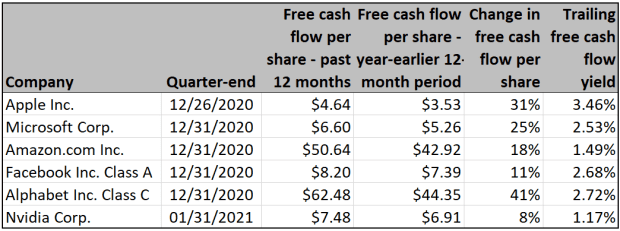
With many companies’ businesses tied to intellectual property and services, some professional investors believe a focus on cash-flow generation can be more important in the modern economy than traditional measures of value, such as price-to-book or even price-to-earnings ratios. A company’s free cash flow (FCF) yield can be calculated by dividing its trailing 12 months’ FCF by the current share price.
For Apple and the five other large tech companies being compared here, FCF can fluctuate greatly from quarter to quarter.
Here’s a comparison of the six companies’ changes in free cash flow per share for the past 12 reported months from the year-earlier 12-month period, along with trailing 12-month free cash flow yields, based on closing share prices on April 16:
(FactSet)
So Apple has come in second, after Alphabet, for FCF growth over the past 12 months. Apple has the highest FCF yield among this group.
Stock valuation and performance
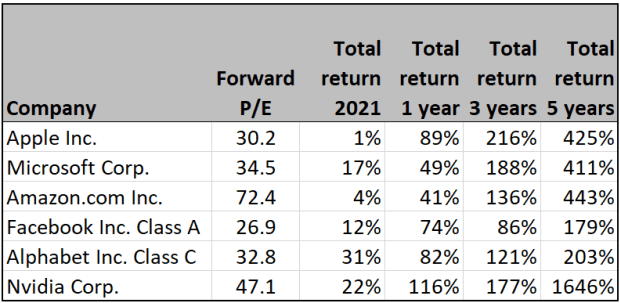
Here are price-to-earnings (P/E) valuations for the six stocks, based on consensus earnings estimates for the next 12 months among analysts polled by FactSet, along with total return figures through April 16:
(FactSet)
Apple has the second-lowest forward P/E ratio. It has been the best performer among the group for three years and ranks third for five years.
Wall Street’s opinion
Here’s a summary of opinion among Wall Street analysts polled by FactSet:
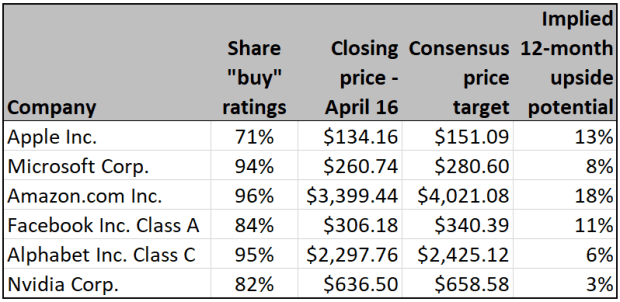
(FactSet)
The analysts working for brokerage companies love these stocks. But industry price targets are for only one year, even though that is a relatively short period for a long-term investor. So the price targets aren’t aggressive, despite the positive sentiment. Apple has the lowest percentage of “buy” or equivalent ratings but the second-highest implied 12-month upside.
Important dates
- April 20 — Apple will make new-product announcements.
- April 28 — Apple will announce its fiscal second-quarter results after the market close.
If you liked the article, do not forget to share it with your friends. Follow us on Google News too, click on the star and choose us from your favorites.
For forums sites go to Forum.BuradaBiliyorum.Com
If you want to read more News articles, you can visit our News category.