#Outside the Box: How safe is the stock market?

Table of Contents
“Outside the Box: How safe is the stock market?”
Long-term investors reap the rewards of a bit of risk.
I am often asked how safe the stock market is — especially after periods like 2022.
It’s a valid question and impossible to answer definitively except to remind people that what investors get paid for is taking risks. When you take a risk, you actively invite (if not exactly welcome) the possibility that you could actually lose something valuable.
However, people take all sorts of risks every hour of every day. They do this for many reasons, but almost always there’s some payoff that’s imagined or expected.
The stock market is no different. If you take what looks like no risk, for example by keeping your money in government-insured bank accounts, it might seem that you won’t lose.
Except that you will lose.
You will end up with at least the same number of dollars as you started with — and probably more. But your interest earnings won’t be enough to keep up with inflation — and that income might be taxed.
In order to at least keep up with inflation, you’ve got to take some risk. The trick is to take intelligent risk, and in my view the best place to do that is in the stock market — so long as you invest intelligently.
At a minimum, that means keeping your expenses low, diversifying widely and wisely, and focusing on longer time periods instead of short-term ones.
The rest of this article is about the difference between short-term investing and long-term investing.
One year at a time, market returns are pretty random.
In Figure 1 below, each dot represents a single calendar-year return for the S&P 500 index
SPX,
As you look across from left to right, you’re tracking the decades over 95 years.
You’ll see a few really awful years: 1931, 1937, and 2008; plus some really terrific years, including 1933 and 1954. But beyond that, the returns seem pretty random.
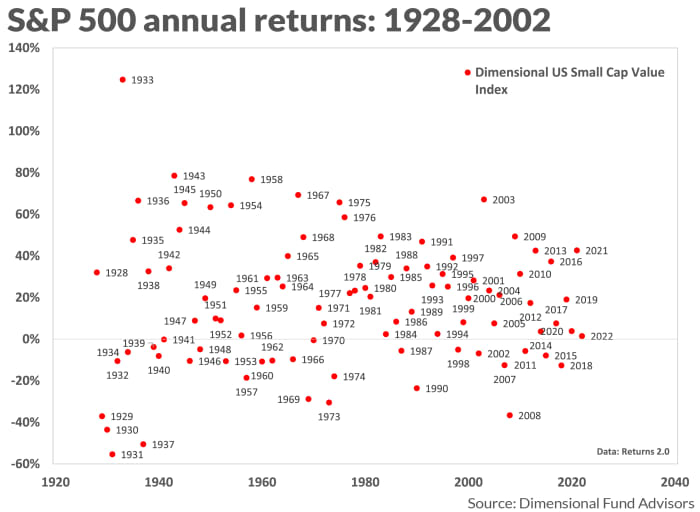
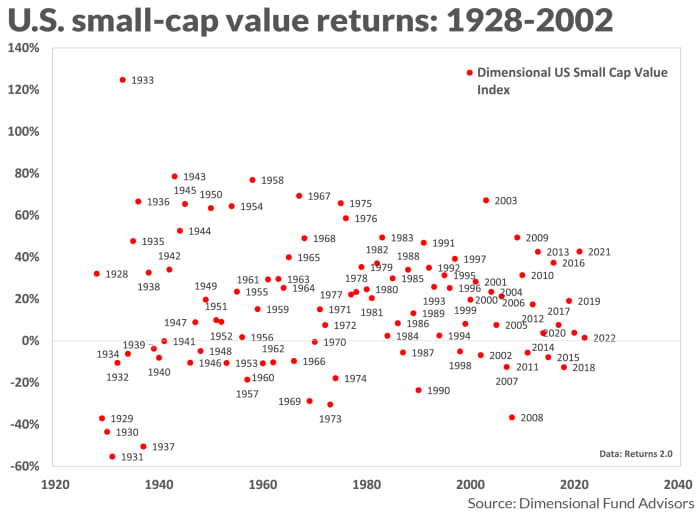
Figure 2 is similar, showing returns for U.S. small-cap value stocks. You’ll find one incredibly good year and a generous handful of returns over 60%. On the downside, one of the biggest losses occurred in 2008, and most of the rest in the 1930s.
When you combine those graphics into one, the randomness is emphasized. If you want to take a look, you can do so here.
All this data may seem dense. But don’t give up yet.
The following three tables can help make some sense of it.
Table A: One-year returns, 1928-2022
| Best single year | Worst single year | |
| S&P 500 index | up 54% | down 43.3% |
| U.S. small-cap value | up 124.7% | down 55.4% |
| 50/50 combination | up 89.4% | down 49.4% |
| Source: Merriman Financial Education Foundation |
One year at a time, the results show a lot of variety. The difference between the best year and the worst year was much greater for small-cap value than for the S&P 500.
The third line shows the results of combining equal parts of those two asset classes.
As you’ll see in Table B, for investors who held on to one or both of these asset classes for 15 years, the variability of returns was much lower.
Table B: 15-year returns, 1928-2022
| Best 15 years | Worst 15 years | |
| S&P 500 index | up 18.9% | down 8.6% |
| U.S. small-cap value | up 26.5% | down 1.9% |
| 50/50 combination | up 23.9% | up 0.3% |
| Source: Merriman Financial Education Foundation |
Table C: 30-year returns, 1928-2022
| Best 30 years | Worst 30 years | |
| S&P 500 index | up 13.7% | up 8.5% |
| U.S. small-cap value | up 22.7% | up 8.4% |
| 50/50 combination | up 18.6% | up 8.8% |
| Source: Merriman Financial Education Foundation |
Table C is the real eye-opener among these three.
The worst 30-year periods in each case were positive. They were all reasonably productive. And the worst 30-year losses were remarkably close to each other.
Sure, there’s a difference between 8.4% and 8.8%. Over 30 years, an investment of $10,000 would grow to $112,429 at the lower rate vs. $125,564 at the higher rate. But that’s hardly a life-changing difference.
However, the differences between the best periods were considerably more dramatic.
A 30-year investment compounding at 13.7% (the S&P 500) would grow to $470,775. At 22.7% (small-cap value) the comparable result would be hard to believe: $4.63 million.
Still, not many investors would be willing to stick with an all-small-cap-value portfolio for 30 years. The 18.6% return of the 50/50 combination would be easier to stomach, and it would turn $10,000 into $1.67 million.
These tables illustrate a few lessons for investors.
- The variability of returns is much lower in longer periods;
- The differences between the best returns are usually greater than the differences between the worst returns.
- Combining the S&P 500 and small-cap value provided a smoother ride in one-year and 15-year periods and provided the highest 30-year return.
Here’s something else: Regardless of what time period you measure, small-cap value has been by far the most likely to be the top performer among the four major U.S. asset classes, which also include small-cap blend and large-cap value in addition to the S&P 500.
This supports my view that small-cap value can be a worthwhile addition to any long-term portfolio, even if it plays only a modest role.
I think there’s at least one more valuable lesson for all the colored dots in Figures 1 and 2 above.
The next time you hear someone predicting the stock market, remember: This year or next year, the S&P 500 has demonstrated that it could be up by more than 50% — or down by more than 40%.
Here are two pieces of data, covering all the calendar years from 1928 through 2022, that can help narrow that down a little.
- Two-thirds of the returns for the S&P 500 fell between minus 10% and plus 30%.
- Two-thirds of the returns for small-cap value stocks fell between minus 30% and plus 40%.
Want to know more about small-cap value investing? Check out my video “20 things you should know about small-cap value stocks.”
Richard Buck contributed to this article.
Paul Merriman and Richard Buck are the authors of “We’re Talking Millions! 12 Simple Ways to Supercharge Your Retirement.” Get your free copy.
If you liked the article, do not forget to share it with your friends. Follow us on Google News too, click on the star and choose us from your favorites.
For forums sites go to Forum.BuradaBiliyorum.Com
If you want to read more News articles, you can visit our News category.