# Less state debt, but a ‘lost decade’ for U.S. infrastructure spending, S&P finds

Table of Contents
“#
Less state debt, but a ‘lost decade’ for U.S. infrastructure spending, S&P finds
”
Have states taken fiscal discipline too far?
Most U.S. states took on less debt during the COVID-19 pandemic, continuing a years-long stretch of deleveraging, according to a report published Friday from credit rating agency, Standard & Poor’s. But an emphasis on pay-as-you-go spending for infrastructure is likely constraining needed upgrades, the report argues.
As governments scrambled to figure out how to manage through the COVID crisis, normal spending patterns were upended, the report notes. Many states postponed bond sales or decreased the amount they issued: aggregate state debt backed by taxes (as opposed to revenues from things like user fees) declined 0.7% in fiscal year 2020 compared to 2019.
“Median debt per capita averaged approximately $947 over the last five years, declining 8.5% from the peak level of $1,036 per capita in 2012,” they write. “Since 2009, median aggregate debt of states fell by nearly 7.5% with approximately one-third of states reducing their total outstanding net tax-supported debt.”
The report cites data from the National Association of State Budget Officers (NASBO) which shows that capital spending increased by 10.3% in fiscal year 2020 from 2019, to $126.6 billion, the highest level in 20 years. But pay-as-you-go funding made up 74% of state spending on capex. The 26% of spending coming from bond proceeds was the lowest share since 2001.
The S&P analysts believe this ongoing deleveraging among many states might be an ongoing reaction to the aftermath of the Great Recession in 2008. That downturn and the following low, slow recovery “constrained states’ discretionary spending, coupled with efforts to contain spending on Medicaid, pensions, and retiree health care benefits that outpaced revenue growth.”
Importantly, the report notes, many governments are making hard decisions about infrastructure based not only on the immediate capex cost, but ongoing maintenance as well. Such considerations mean infrastructure has fallen short of what they deem necessary, perhaps by as much as $1.5 trillion, as noted in the chart below, which tallies spending from local governments as well as states.
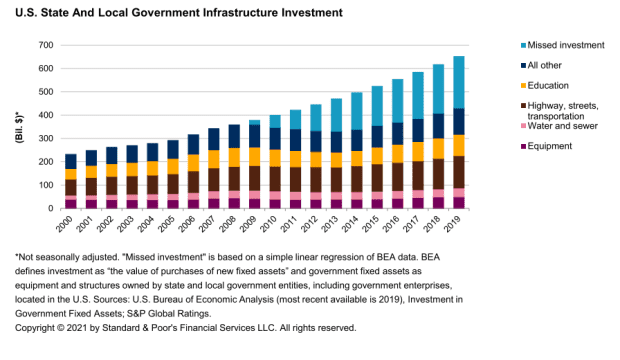
For that reason, the analysts call the period after the Great Recession a “lost decade” for infrastructure spending.
“This missed opportunity contributed to a decade of shallow economic growth, missed productivity gains, and deferred maintenance that would inevitably increase the costs of deferred capital projects,” they write.
Read next: This chart shows why we need ‘infrastructure week’ so badly
If you liked the article, do not forget to share it with your friends. Follow us on Google News too, click on the star and choose us from your favorites.
For forums sites go to Forum.BuradaBiliyorum.Com
If you want to read more News articles, you can visit our News category.


