#Market Extra: The Nasdaq is on track to exit a bear market — and the Dow to leave correction territory — after July CPI reading

Table of Contents
“Market Extra: The Nasdaq is on track to exit a bear market — and the Dow to leave correction territory — after July CPI reading”
Nasdaq Composite will exit bear market territory if it closes above 12,775, but some strategists say the best part of the rally is over
The Nasdaq Composite was on track to exit a brutal bear market Wednesday, while the Dow Jones Industrial Average was set to end a market correction, as stocks rallied in the wake of a cooler July inflation reading.
The Nasdaq Composite
COMP,
was up 2.5% near 12,810 in midday trade. According to Dow Jones Market Data, a finish at or above 12,775.32 would mark a 20% or more rise from Nasdaq’s June 16 closing low at 10,646.10, meeting widely used criteria for exiting a bear market (see chart below).
The Dow
DJIA,
meanwhile, was up roughly 540 points, or 1.6%, near 33,315. A finish above 32,877.66 would see the blue-chip gauge, which has dodged a bear market, log a rise of 10% or more from its correction low.
Stocks were finding support after a headline consumer-price index for July showed a better-than-expected slowdown for rising prices. But some market watchers were wary of sounding the all-clear based on indexes clearing an arbitrary threshold.
“One of the most enduring signals for when we leave a bear market is when 90% of the S&P 500 stocks shoot through their 50-day moving average, then it moves towards escape velocity,” Quincy Krosby, chief global strategist at brokerage LPL Financia, told MarketWatch by phone on Tuesday.
According to Dow Jones Market Data, as of Monday, only 77.3% of S&P 500
SPX,
stocks and 74.2% of Nasdaq Composite
COMP,
stocks closed above their 50-day moving average.
See: We’re in a bear-market rally and you can expect the June 2022 lows to be broken
The Nasdaq fell 33.7% from its recent high to bear market low, and has been in bear market territory for 107 trading days. The decline marks the deepest and longest bear market since 2008, when the index fell 54% and the period lasted 218 trading days, according to Dow Jones Market Data.
For other indexes, of course, it’s the S&P 500
SPX,
— the U.S. large-cap benchmark — that really counts when it comes to U.S. equities. The index has also bounced, but remains in a bear market after completing a slide of more than 20% from its record finish on January 3.
Morgan Stanley’s Michael Wilson, one of Wall Street’s most vocal bears, also argued that the best part of the rally was over.
“The rally in stocks has been powerful and has investors believing the bear market is over and looking forward to better times,” the chief investment officer said in a Monday client note. “However, we think it’s premature to sound all-clear simply because inflation has peaked. The next leg lower may have to wait until September when our negative operating leverage thesis is better reflected in earnings estimates. However, with valuations this stretched, we think the best part of the rally is over.”
See: Veteran strategist Dennis Gartman says it’s still a bear market with no Fed pivot in sight
Meanwhile, the Dow Jones Industrial Average
DJIA,
the popular gauge of 30 so-called blue-chip companies, has not only dodged a bear market, but has traded on the cusp of exiting correction territory. The Dow hasn’t suffered a 20% drawdown — the arbitrary market used in a popular definition of a bear market. It’s slide of more than 10% from its early January record finish, however, did qualify for a market correction.
See: A surging stock market is on the verge of signaling a ‘huge’ move — but there’s a catch
What history tells us
So, what does history tell us about the Nasdaq if it enters bull market territory, and what it says about the Dow when it leaves a correction?
Dow Jones Market Data compiled the tables below:
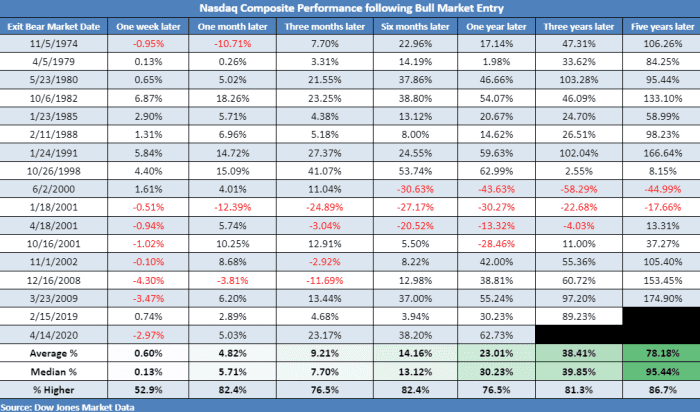
Nasdaq performance following an entrance into a bull market.
SOURCE: DOW JONES MARKET DATA
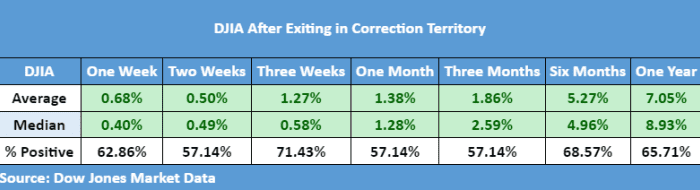
The table below is based on all corrections since 1950, but it excludes corrections that later turned into bear markets.
SOURCE: DOW JONES MARKET DATA
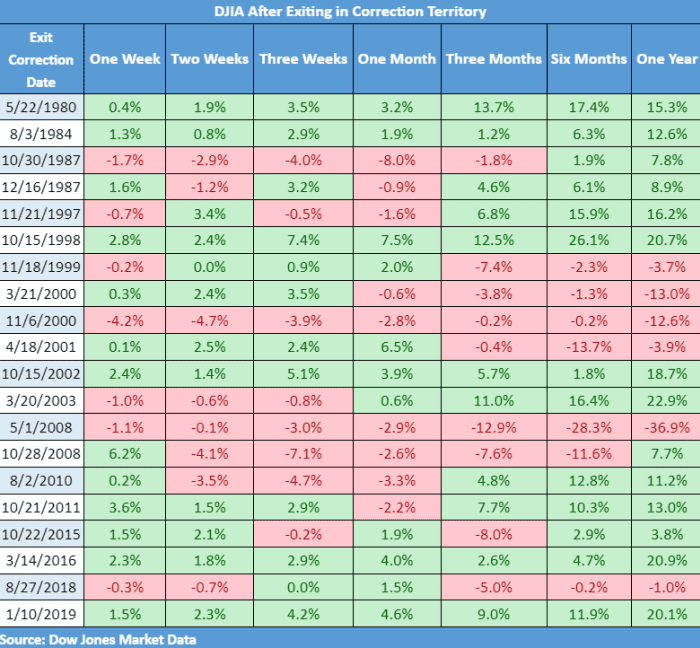
The last 20 corrections and the following performance in the DJIA
SOURCE: DOW JONES MARKET DATA
If you liked the article, do not forget to share it with your friends. Follow us on Google News too, click on the star and choose us from your favorites.
For forums sites go to Forum.BuradaBiliyorum.Com
If you want to read more News articles, you can visit our News category.