#ETF Wrap: As stock-market turbulence revs up, this ETF theme has drawn 32% of flows in 2022 so far: ‘This isn’t a flash in the pan’
Table of Contents
“#ETF Wrap: As stock-market turbulence revs up, this ETF theme has drawn 32% of flows in 2022 so far: ‘This isn’t a flash in the pan’”
‘Value [investors] are saying “this is time and I’m committed”‘
Thank god its Thursday! The Nasdaq Composite posted its first correction since March and equity benchmarks were trying to stage a mini rally, at last check on Thursday.
See: The Nasdaq Composite just logged its 66th correction since 1971. Here’s what history says happens next to the stock market.
Don’t fret! Low-cost ETFs are still one of the best ways to gain exposure to the markets while avoiding single-stock risk, but we’ll walk you through some strategies and help to identify what has been working and what hasn’t since the start of the year.
Send tips, or feedback, and find me on Twitter at @mdecambre or LinkedIn, as some of you are wont to do, to tell me what we need to be covering.
SIGN UP NOW TO GET ETF WRAP SENT FRESH TO YOUR INBOX WEEKLY
Read: What is an ETF? We’ll explain.
The bad
| Top 5 gainers of the past week | %Performance |
|
iShares MSCI Russia ETF ERUS, |
-14.1 |
|
VanEck Russia ETF RSX, |
-13.3 |
|
ARK Genomic Revolution ETF ARKG, |
-12.6 |
|
ARK Innovation ETF ARKK, |
-11.6 |
|
ARK Fintech Innovation ETF ARKF, |
-11.1 |
| Source: FactSet, through Wednesday, Jan. 19, excluding ETNs and leveraged products. Includes NYSE, Nasdaq and Cboe traded ETFs of $500 million or greater |
…and the good
| Top 5 decliners of the past week | %Performance |
|
U.S. Oil Fund LP USO, |
4.8 |
| Global X Copper Miners ETF | 3.9 |
|
iShares Global Energy ETF IXC, |
3.4 |
|
iShares MSCI Brazil ETF EWZ, |
3.2 |
|
Aberdeen Standard Physical Silver Shares ETF SIVR, |
3.1 |
| Source: FactSet |
Value in vogue
ETF Wrap caught up with Bloomberg ETF analyst Eric Balchunas on Thursday and he walked us through the landscape in funds, with the Nasdaq Composite Index
COMP,
in correction, and choppy trade in the Dow Jones Industrial Average
DJIA,
and the broad-market S&P 500 index
SPX,
becoming more the norm so far in January.
His message was pretty clear: value is the place where investors this year feel that they need to be, and he predicted that the shift taking shape in the value factor, an area of the market hat has taken a back seat to growth and highflying technology stocks since the 2008 financial crisis, thus far in 2022, may be the real deal.
“This isn’t a flash in the pan,” Balchunas said. “Value [investors] are saying that it’s time and I am committed,” the Bloomberg Intelligence analyst said.
Read: Value stocks have pulled ahead of growth in recent weeks. Is it a head-fake?
And it isn’t merely about the performance of value over growth that Balchunas is highlighting. Thus far, 32% of the net inflows this year, or $5.6 billion of $17.6 billion, have been directed to value factor ETFs.
And the allocation has been diverse. More than 80 value ETFs drew net inflows, led by biggies Vanguard Value ETF
VTV,
and the iShares S&P 500 Value ETF
IVE,
The year-to-date outperformance is besides the point but still notable, with the comparable iShares S&P 500 Growth ETF
IVW,
looking at an over 7 percentage point gap between itself and the IVE (see attached of the iShares Value ETF’s performance versus growth so far this year). That is the largest outperformance over the first 13 days of the year on record (based on data back to 2001), according to Dow Jones Market Data.
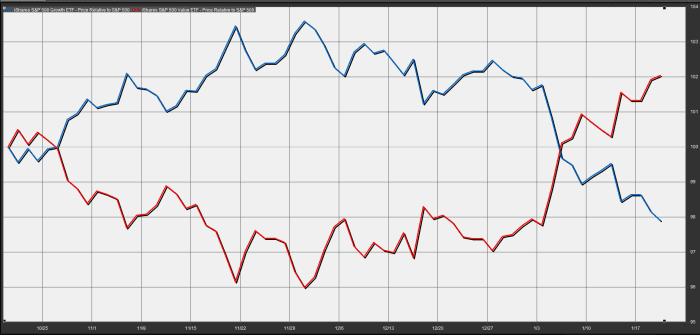
FactSet
And international value, ETFs focused on the factor outside of the U.S., also are buzzing. The iShares MSCI EAFE Value ETF
EFV,
is up 4.8% so far this year and within the top three of funds attracting investors, Balchunas said.
Growth on the other hand is getting smacked around, but the bulk of that pain is being felt in the Invesco QQQ Trust
QQQ,
which is down 6.4% so far in 2022 and has seen about $3.3 billion come out of the ETF, representing a chunk of the $6.5 billion that has flowed out of growth factor funds so far this year.
An ETF traders field guide
How do you play this wacky market?
We chatted with Frank Cappelleri, executive director and technical analyst at Instinet and he offered a few insights on the carnage he’s seen as well as the potential opportunities.
Cappelleri said buy-the-dip traders may be losing confidence with this recent bout of volatility. He said that the fact that we haven’t gotten to so-called oversold conditions yet makes him cautious about wading into the market with both feet.
The S&P 500 hasn’t been officially oversold, based on momentum measures such as the relative strength index, “since 3/12/20–a run of 468 straight days—one of the longest streaks in recent history,” Cappelleri said.
The market is still looking for an oversold reading, which might signal a healthy flush out, or capitulation by the bulls, which might merit an entry point into an increasingly choppy market. A downturn that signals a washout or a rally that must be chased by fund managers could be one indicator that it is time to get in, he noted. But it’s only one factor.
“The way I look at it, you never know which one of these bounces is going to be meaningful,” Cappelleri said.
The Instinet exec said that speculative investments such as the Cathie Wood’s ARK Innovation ETF
ARKK,
and the SPDR S&P Biotech ETF
XBI,
were “breaking down.”
He also said that semiconductor funds, which represent the heart of the technology sector’s outlook for growth, have been hammered.
The VanEck Semiconductor ETF
SMH,
is down 6.8% in the year to date and iShares Semiconductor ETF
SOXX,
is off 7.6%.
“SMH or SOXX look similar [and has] really been having a lot of back and forth and now potentially breaking down from a two-month topping formation,” Cappelleri said, referring to the ticker symbols for the funds.
So, what should investors being thinking about as the market whipsaws?
Cappelleri said look for assets and funds to produce lower lows and higher highs to help determine whether an uptrend or a downtrend is in effect. He said knowing the difference between an uptrend and a downtrend is crucial because you want to sell rallies in a downtrend and buy the dip in an uptrend. (As an aside, long-term investors shouldn’t make a practice trying to time the market)
There are some areas where uptrends are in force, based on Cappelleri’s metrics. Materials Select Sector SPDR Fund
XLB,
which replicates the S&P 500’s materials sector and Industrial Select Sector SPDR Fund
XLI,
which tracks industrials, aren’t far from their highs and could be worth dip buying.
Cyclical sectors such as the energy
SP500.10,
XLE,
and financials
SP400.40,
XLF,
also have been hot so far this year, while communication services
SP500.50,
XLC,
were seen trying to stabilize, Cappelleri said.
…and one more thing
Bloomberg’s Balchunas says that individual investors are showing signs of their commitment to this market, which may serve as a bullish indicator for some market watchers. He said that retail investors were seeing an opportunity for cheap beta and taking it. He said retail was showing “diamond hands” times 10, an expression often used in social-media platforms to refer to an investor who isn’t inclined to sell and is holding a good investment for the long term.
That said, Balchunas sees cash-like investments also growing in popularity as Treasury yields, such as the 10-year
TMUBMUSD10Y,
and 2-year Treasurys
TMUBMUSD02Y,
rise and as market turbulence persists. The iShares Short Treasury Bond ETF
SHV,
which tracks a market-weighted basket of short-term securities, is one area that he pointed to as having typically drawn flows among investors who turn to cash. The ETF manages over $13 billion and carries a 0.15% expense ratio, translating to an annual expense of $1.50 for every $1,000 invested. He also called out the slightly longer-term iShares 1-3 year Treasury Bond ETF
SHY,
which carries the same expense ratio and manages $21 billion.
Popular ETF reads
- Hedge-fund manager says Ark ETF stocks are a potential ‘time bomb’ (CNBC Pro)
- Cathie Wood’s ARK Innovation ETF has lagged the Nasdaq since 2018—while collecting over $200 million in fees (Fortune)
- Breakfast ETF Will Track Coffee, Orange Juice and Hogs (Bloomberg)
- BlackRock Alumni Have a New Gameplan to Disrupt Junk-Debt ETFs (Bloomberg)
—That’s a Wrap
If you liked the article, do not forget to share it with your friends. Follow us on Google News too, click on the star and choose us from your favorites.
For forums sites go to Forum.BuradaBiliyorum.Com
If you want to read more News articles, you can visit our News category.


