#Deep Dive: 20 big oil companies expected to be cash gushers in 2023 despite short-term uncertainty
Table of Contents
“Deep Dive: 20 big oil companies expected to be cash gushers in 2023 despite short-term uncertainty”
The oil industry faces san earnings decline, but the long-term outlook is healthy, according to analysts at Jefferies
The energy sector of the S&P 500 has been the year’s best performer, yet oil stocks still appear to be inexpensive when compared with those in other industries.
If you are interested in investing in energy, your time frame is important. The oil industry seems to have a good long-term setup for prices, but also faces difficult earnings comparisons in 2023.
Oil industry is expected to earn less in 2023
When discussing the recent decline in oil prices in a note to clients on Nov. 30, Jefferies’ global equity strategist Sean Darby wrote: “Chinese growth has acted as a headwind for global demand as it enforces strict Covid policies coming into the winter flu season.”
Here’s a look at the 11 sectors of the S&P 500, sorted by price-to-earnings ratios that are based on Nov. 29 prices and weighted consensus 2023 earnings estimates among analysts polled by FactSet, with the full index at the bottom:
| Sector | Forward P/E based on 2023 EPS estimate | Estimated 2023 EPS | Estimated 2022 EPS | Estimated FCF – 2023 | Estimated FCF – 2022 |
| Energy | 9.9 | $70.02 | $80.36 | $68.64 | $84.90 |
| Financials | 12.3 | $48.32 | $42.04 | N/A | N/A |
| Communication Services | 14.7 | $11.18 | $10.09 | $10.89 | $9.31 |
| Materials | 16.5 | $30.84 | $33.86 | $26.19 | $25.64 |
| Real Estate | 16.9 | $14.24 | $13.84 | $12.01 | $7.70 |
| Health Care | 17.5 | $90.44 | $93.66 | $90.89 | $90.86 |
| Utilities | 18.4 | $19.11 | $17.90 | -$7.63 | -$10.36 |
| Industrials | 18.4 | $45.81 | $40.06 | $41.11 | $33.48 |
| Information Technology | 20.7 | $108.94 | $104.30 | $108.14 | $96.17 |
| Consumer Staples | 21.3 | $37.10 | $35.70 | $33.89 | $31.15 |
| Consumer Discretionary | 22.8 | $47.99 | $35.27 | $43.26 | $26.58 |
| S&P 500 | 17.1 | $230.81 | $218.56 | $198.66 | $180.54 |
| Source: FactSet | |||||
The energy sector is one of three (along with materials and health care) for which analysts expect earnings per share to decline next year. And it is the only one for which free cash flow per share is expected to decline.
This means investors have to expect some difficult year-over-year comparisons of results during each quarterly earnings season in 2023.
Long-term outlook for oil prices and stocks
To set the stage for this discussion, let’s start with a 10-year chart for West Texas Intermediate (WTI) crude oil
CL,
based on continuous front-month contracts on the New York Mercantile Exchange, as tracked by FactSet:
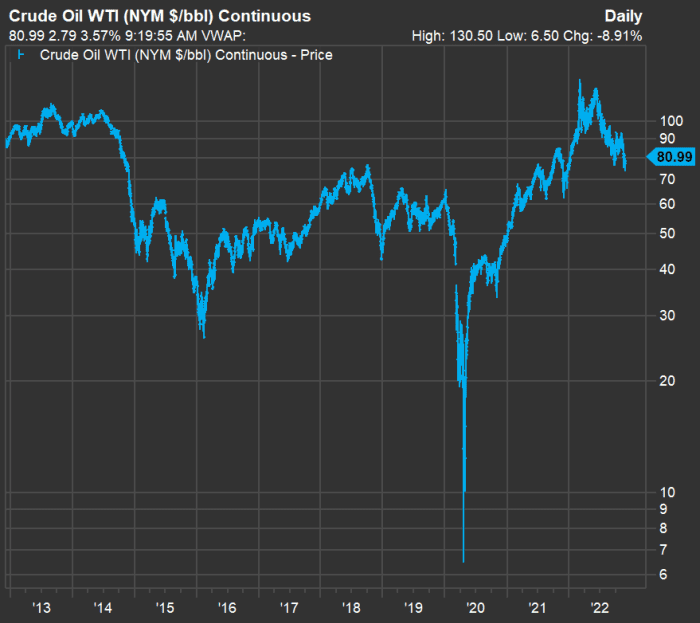
FactSet
This chart takes us through the supply-driven decline in oil prices from the middle of 2014 through early 2016, and the dramatic plunge during the early stage of the coronavirus pandemic in 2020, which Darby wrote was “easy to forget” in light of the high-demand environment this year.
You can also see that WTI has given up most of this year’s gain. It closed at $75.21 at the end of 2021, hit a 2022 intraday peak of $130.50 on March 7 and fell to an intraday low for the year of $73.60 on Nov. 28 before rising over the next two days.
“The lack of upstream investment over the past decade and an unwillingness of developed world economies to add sufficient capacity domestically, preferring ‘renewables.’ has meant that global energy companies have run their businesses for cash.”
Darby described himself and his research team as “long-term energy bulls” but “modestly bearish” for the energy sector in the shorter-term. Jefferies has “buy” ratings on eight energy stocks in the S&P 500, including ConocoPhillips
COP
and Exxon Mobil Corp.
XOM
(The full Jefferies “buy” list is below.)
Darby sees a positive long-term setup for oil prices: “The lack of upstream investment over the past decade and an unwillingness of developed world economies to add sufficient capacity domestically, preferring ‘renewables,’ has meant that global energy companies have run their businesses for cash.”
Indeed, executives of many large oil companies this year have emphasized careful capital investment to avoid repeating the mistakes made when the ramping of U.S. production led to an oversupply and a long decline in prices that began in 2014.
At the same time, oil companies have been raising regular dividends, paying special dividends and emphasizing share buybacks. If stock repurchases are sufficient to lower the share count, earnings per share will increase and potentially support higher share prices.
Free cash flow screen of companies for 2023
A company’s free cash flow (FCF) is its remaining cash flow after capital expenditures. This is money that can be used to pay dividends, buy back shares, fund production expansion or acquisitions, or for other corporate purposes. It can be useful for investors to compare expected FCF to current dividend payouts to understand whether a company is likely to be able to support its dividend or raise it, or whether it may have to consider cutting the payout.
If we compare the expected FCF yield to the current dividend yield, we can estimate if there is “headroom” for deployment of additional cash, hopefully in a way that benefits shareholders.
For this screen, we began with the 51 stocks in the iShares Global Energy ETF
IXC
(which includes all 23 stocks in the S&P 500 energy sector), and then filtered out companies for which 2023 FCF estimates were not available and those for which the estimated FCF yields were lower than the current dividend yields. This left us with a group of 44 stocks showing FCF “headroom” for 2023.
Here are the 20 with the highest expected free cash flow yields for next year:
| Company | Ticker | Country | Est. 2023 FCF yield | Dividend yield | Est. 2023 “headroom” | Est. 2023 FCF per share | Est. 2022 FCF per share |
| Equinor ASA | EQNR | Norway | 27.72% | 2.11% | 25.61% | 104.50 | 102.20 |
| Empresas Copec S.A. | CL:COPEC | Chile | 24.67% | 2.48% | 22.19% | 1488.79 | 1030.72 |
| EQT Corp. | EQT | U.S. | 24.61% | 1.41% | 23.21% | 10.50 | 5.61 |
| Eni S.p.A. | IT:ENI | Italy | 24.22% | 6.20% | 18.02% | 3.44 | 3.75 |
| Marathon Oil Corp. | MRO | U.S. | 21.19% | 1.05% | 20.13% | 6.43 | 6.12 |
| Ecopetrol S.A. ADR | EC | Colombia | 21.06% | 14.08% | 6.97% | 2.18 | 3.03 |
| Inpex Corp. | JP:1605 | Japan | 18.73% | 3.86% | 14.86% | 291.00 | 104.75 |
| BP PLC | UK:BP | U.K. | 17.85% | 4.06% | 13.79% | 0.88 | 1.13 |
| APA Corp. | APA | U.S. | 17.09% | 2.15% | 14.94% | 7.96 | 9.80 |
| Galp Energia SGPS S.A. Class B | PT:GALP | Portugal | 16.82% | 4.40% | 12.42% | 1.95 | 1.69 |
| Shell PLC | UK:SHEL | U.K. | 16.62% | 3.47% | 13.15% | 3.99 | 4.88 |
| ENEOS Holdings, Inc. | JP:5020 | Japan | 16.47% | 4.69% | 11.77% | 77.19 | N/A |
| TotalEnergies SE | TTE | France | 16.26% | 4.63% | 11.63% | 9.58 | 11.74 |
| Repsol S.A. | ES:REP | Spain | 15.94% | 1.83% | 14.11% | 2.33 | 4.15 |
| Tourmaline Oil Corp. | CA:TOU | Canada | 15.70% | 1.11% | 14.59% | 12.73 | 9.78 |
| Aker BP ASA | NO:AKRBP | Norway | 15.30% | 6.14% | 9.16% | 51.95 | 52.07 |
| Canadian Natural Resources Ltd. | CNQ | Canada | 15.29% | 4.21% | 11.07% | 12.34 | 13.31 |
| Suncor Energy Inc. | SU | Canada | 15.03% | 4.58% | 10.45% | 6.83 | 8.11 |
| Valero Energy Corp. | VLO | U.S. | 13.91% | 2.90% | 11.01% | 18.81 | 27.58 |
| Ampol Ltd. | AU:ALD | Australia | 13.86% | 5.65% | 8.21% | 3.95 | 3.14 |
Click on the tickers for more about each company. Read Tomi Kilgore’s detailed guide to the wealth of information for free on the MarketWatch quote page.
The free cash flow estimates are for calendar years and are in local currencies. The 2023 FCF estimates are lower than those for 2022 for 11 of the 20 companies, with a 2022 estimate unavailable for ENEOS Holdings Inc.
JP:5020.
The dividend yields are estimated by FactSet: They have a 45-day lag, which means that it is important before investing to do your own research, especially now, when many energy companies are paying regular dividends and special dividends that vary each quarter.
Eight energy stocks rated “buy” at Jefferies
Here are the energy stocks in the S&P 500 rated “buy” by analysts at Jefferies, sorted by expected 2023 free cash flow yields, based on consensus estimates:
| Company | Ticker | Est. 2023 FCF yield | Dividend yield | Est. 2023 “headroom” | Est. 2023 FCF per share | Est. 2022 FCF per share |
| EQT Corp. | EQT | 24.61% | 1.41% | 23.21% | 10.50 | 5.61 |
| Valero Energy Corp. | VLO | 13.91% | 2.90% | 11.01% | 18.81 | 27.58 |
| ConocoPhillips | COP | 12.06% | 1.64% | 10.41% | 14.98 | 17.42 |
| Exxon Mobil Corp. | XOM | 9.95% | 3.29% | 6.65% | 10.99 | 14.79 |
| Halliburton Co. | HAL | 7.77% | 1.29% | 6.48% | 2.89 | 1.33 |
| Baker Hughes Co. Class A | BKR | 7.57% | 2.65% | 4.92% | 2.17 | 1.51 |
| Schlumberger Ltd. | SLB | 5.13% | 1.37% | 3.76% | 2.62 | 1.93 |
| EOG Resources Inc. | EOG | N/A | 2.34% | N/A | N/A | N/A |
EQT Corp.
EQT
and Valero Energy Corp.
VLO
are on both lists. There are no FCF estimates available for EOG Resources Inc.
EOG
Don’t miss: 20 dividend stocks with high yields that have become more attractive right now
If you liked the article, do not forget to share it with your friends. Follow us on Google News too, click on the star and choose us from your favorites.
For forums sites go to Forum.BuradaBiliyorum.Com
If you want to read more News articles, you can visit our News category.


